PCR Sputtered Optical Filters
With our line of PCR Sputtered optical filters, Chroma Technology supplies key components of polymerase chain reaction (PCR) laboratory and clinical test solutions, including digital PCR (ddPCR) and quantitative PCR (qPCR) platforms.
PCR is a technique to make multiple copies of a short sequence of target DNA, exponentially amplifying it. DNA must be amplified so that there is enough material to reliably detect and identify it with a high degree of confidence. PCR is used in a multitude of applications, including infectious disease diagnosis.
If the target DNA sequence from a pathogen of interest is detected in a sample from a patient and subsequently amplified, its presence is confirmed by a fluorescence signal. If the target is an RNA sequence, then DNA that is complementary to the RNA is amplified, as is the case with RNA viruses such as the coronavirus responsible for COVID-19.
The goal of PCR is to make enough of the target DNA region so that its presence can be measured or confirmed for diagnostic, clinical, or experimental purposes. The value of this approach is that only the specific target sequences must be amplified, without needlessly amplifying all the DNA in an entire gene or chromosome.
Deep Understanding of Fluorescence
Chroma Technology has been supplying high-quality PCR filters to major test equipment manufacturers for many years. This has provided Chroma with valuable experience and application expertise. Our technical staff not only have a deep understanding of fluorescence, managing light, and biophotonics but also have extensive experience working with PCR investigators and engineers.
Chroma’s ET filters for fluorescence applications such as PCR provide unmatched levels of spectral precision. This allows for minimizing spectral overlap — which is always present between fluorescent probes — and optimizing the filter pass bands. The high degree of spectral precision ensures reproducible, reliable results, allowing for six or more distinct fluorescence channels. Coupled with the high out-of-band blocking (≥ OD6) and extremely steep transitions from high transmission to deep blocking, these filters deliver the highest available signal-to-noise ratios.
Different approaches have been used by manufacturers of PCR instruments to detect the fluorescence signals associated with the amplified genetic sequences. One variable is the light source. Most instruments use LEDs as light sources to “excite” the fluorophores, generating the fluorescence signal. However, some droplet digital PCR (ddPCR) and chip-based digital PCR (cdPCR) instruments employ lasers as the fluorescence excitation light source.
Another variable is the mode of detection. A PCR instrument may use several individual filter sets, which are optimized for each combination of light source and fluorophore. Multi-band sets can greatly simplify the optical path, reducing the number of filters and therefore the physical space requirements, but they necessarily compromise optimal signal detection and separation. Trade-offs exist between cost, efficiency, reliability, precision, and sensitivity.
Different Detection Schemes
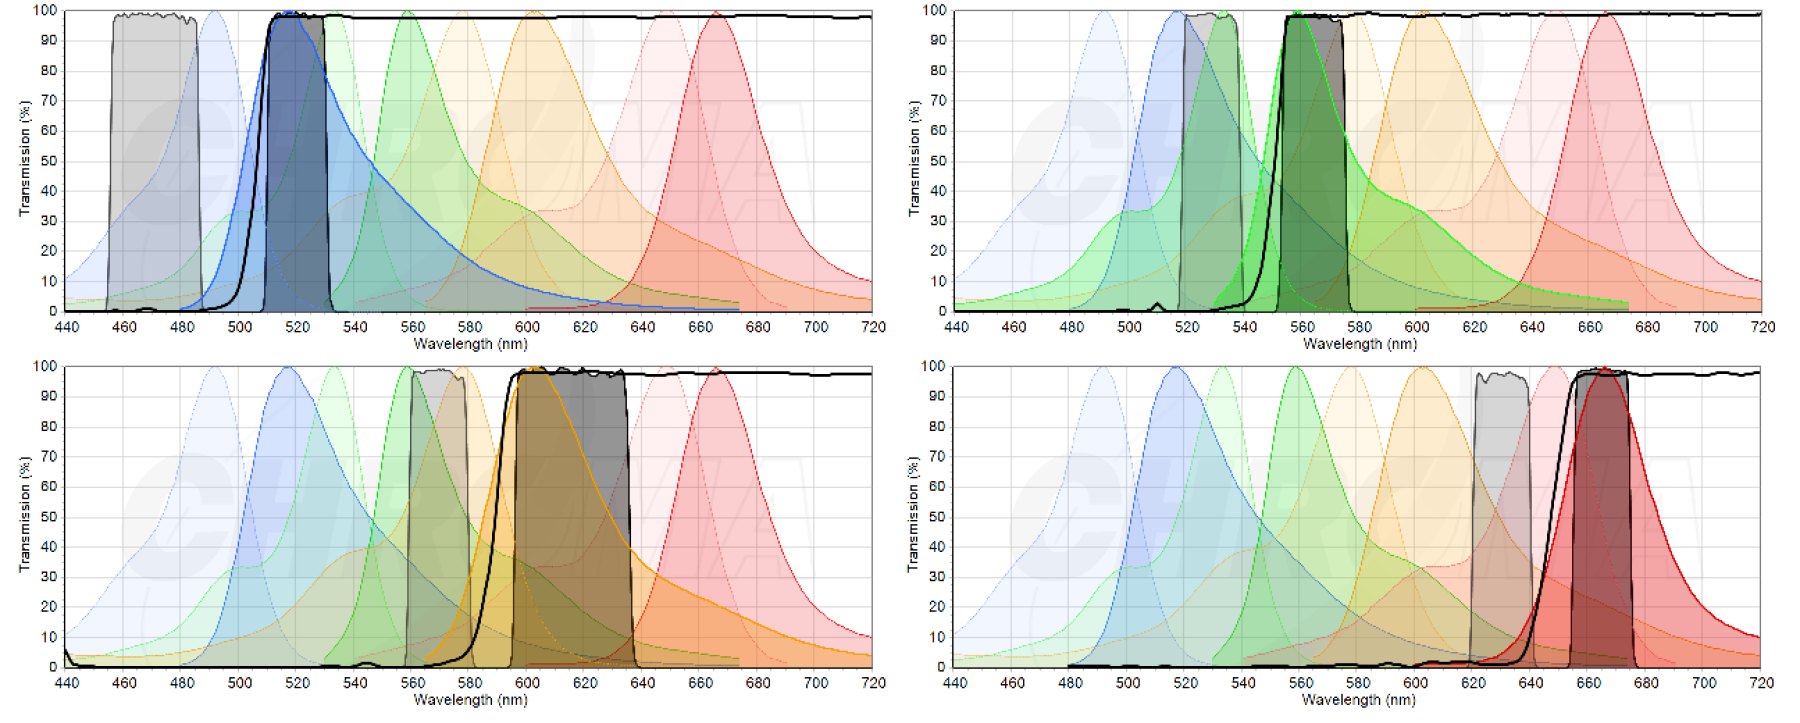
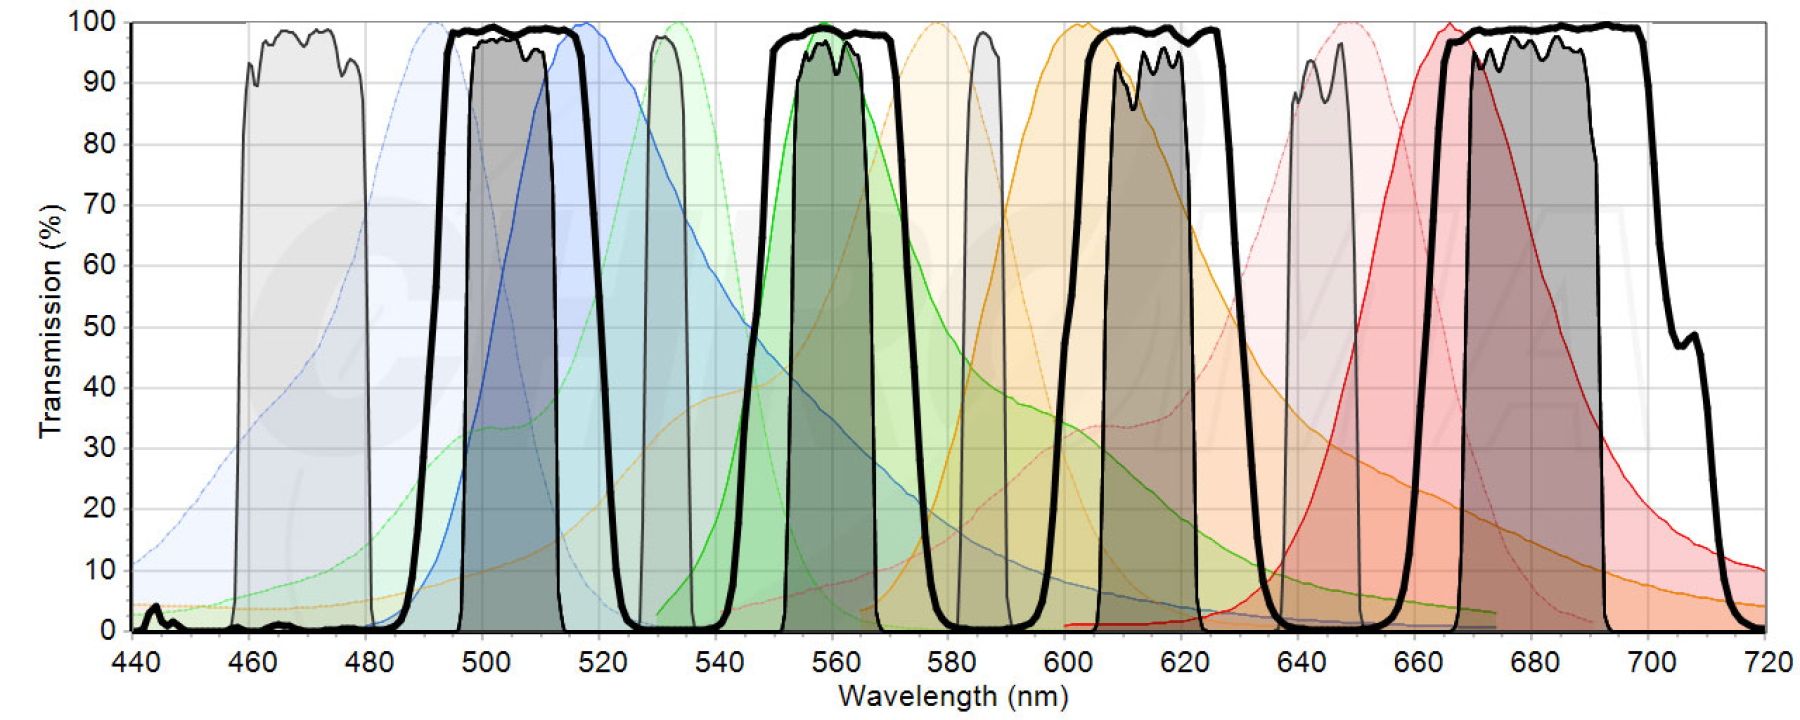
Below is an example of two different detection schemes used to detect the same four commonly used PCR fluorophores: FAM, HEX, ROX, and Cy5. The first scheme uses four single-band filter sets, each one optimized for a particular LED/fluorophore combination. The second uses one multi-band filter set with minimal filters and space requirements but with compromised spectral efficiency. Other detection schemes may require only two fluorophores, while some may require six or more fluorescence channels.
PCR Quantification of DNA
In practice, qPCR provides relative quantification of the DNA, which is then calibrated to a standard curve for a quantitative result, whereas digital PCR provides absolute quantification of the DNA without the need for a reference curve or calibration. In addition to the diagnosis of infectious diseases, PCR is also used in many other areas of biology and medicine, in both clinical and research settings. These include prenatal testing and identifying patient DNA sequences associated with diseases such as cancer.
PCR is also used in some types of next-generation sequencing (NGS), identifying the genetic causes of disease, functional analysis of genes and gene expression, amplification of ancient DNA, tracing heredity, and forensics. Much of this work is done in basic biological research as well as applied research in disciplines as diverse as molecular biology, immunology, ecology, and agriculture.
For more information about our PCR filters and the various solutions Chroma provides, including custom filters, please contact our knowledgeable technical staff to discuss your PCR application and your organization’s unique needs.